
Strengthening statistical analysis skills through the Statistics in Ecology, Environment and Conservation (SEEC) training course
By Daulphin Razafipahatelo and Dr Jessica Thorn
University of Antananarivo, University of Namibia and Imperial College London
August 2026
Building a foundation in R and statistics
From 20 to 24 July 2026, four PhD students from the African Nature Futures Lab participated in a five-day SEEC training course in R and statistical analysis. The course focused not only on understanding statistical concepts, but also on their practical application to research data, including regression models to investigate relationships between variables, experimental designs to test differences among treatments, and logistic and Poisson regression to analyse binary and count data. The training aimed to strengthen both theoretical understanding and hands-on skills in quantitative data analysis. It was organised by Vernon Visser and the SEEC team from the Department of Statistical Sciences at the University of Cape Town.
The course began with an introduction to R and statistics (Figure 1), covering the basic principles of data handling, statistical reasoning and interpretation. This foundation was followed by sessions on simple and multiple linear regression, where participants learned how relationships between response and explanatory variables can be quantified and interpreted.

Figure 1. Presentation showing the trainer, participants, and course title.
The training also introduced extensions of linear models and model selection, helping participants understand how to compare alternative models and identify an appropriate statistical structure for a given research question. It also covered categorical explanatory variables and their interactions, with particular attention to interpreting model coefficients, statistical significance and the role of additional explanatory variables in multiple regression (Figure 2).
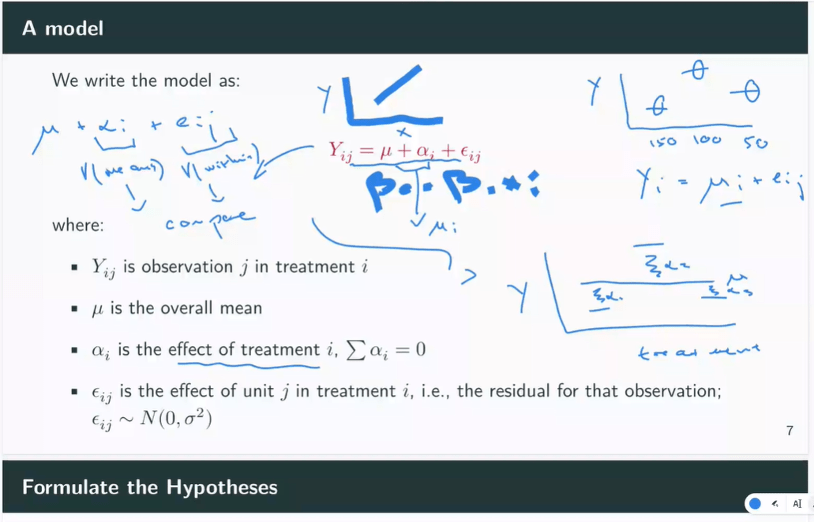
Figure 2 Screenshot showing the way of writing the model and its parameters.
From study design to statistical models
Another major component focused on experimental design (Figure 3). Participants examined the distinction between observational and experimental studies and discussed key concepts including randomisation, control, replication and blocking. These principles are essential for ensuring that observed differences can be interpreted appropriately and that statistical conclusions are supported by the study design.
The training then progressed to randomised designs, blocking and factorial experiments. Participants learned how experiments involving multiple variables can be analysed simultaneously and how to distinguish between main and interaction effects.
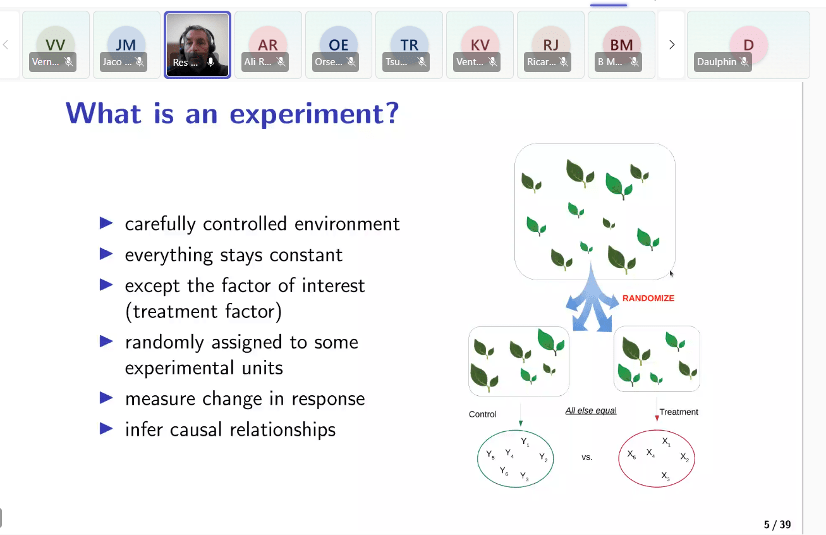
Figure 3 Screenshot presenting the experiment components
Learning through practical application
The practical sessions were an important part of the course. Participants were frequently divided into two groups, creating a more interactive learning environment and allowing closer support from tutors while working through statistical exercises in RStudio. During the sessions, participants applied theoretical concepts to real datasets. Exercises included fitting regression models, generating and interpreting ANOVA tables, examining interactions and evaluating statistical significance (Figure 4). Participants also practised interpreting model outputs and linking statistical results back to the original research question.
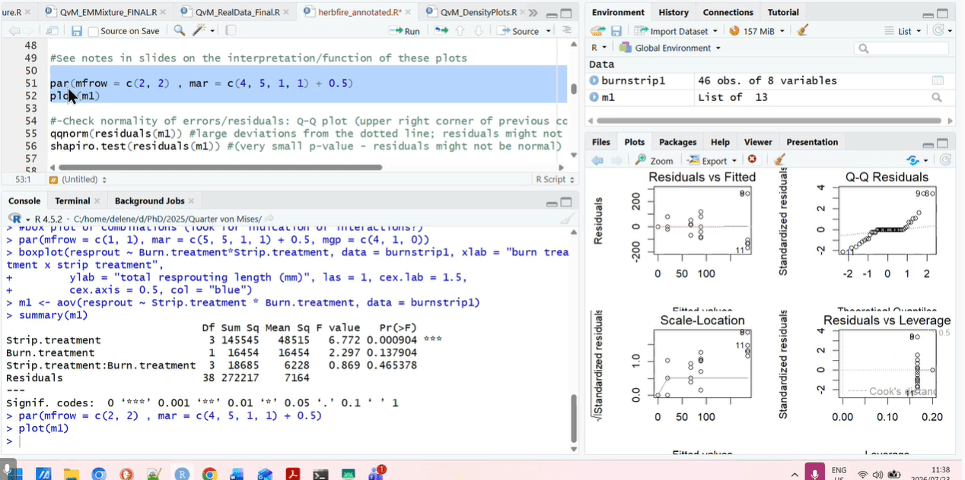
Figure 4. RStudio screenshot showing code in the upper-left window and residual diagnostic plots in the lower-right window.
An important lesson was that statistical analysis does not end after a model has been fitted. Participants were introduced to model diagnostics, including residual-versus-fitted plots, Q–Q plots, influential observations and leverage. These tools help assess whether statistical assumptions are reasonably satisfied and whether model results can be interpreted reliably.
Applying models to different types of data
The final sessions introduced logistic regression and Poisson regression. These methods are particularly useful when response variables are binary or represent count data rather than continuous measurements. Logistic regression was introduced for binary outcomes, while Poisson regression was used to model count data.
From models to meaningful research
Overall, the training provided participants with a structured approach to quantitative analysis: from understanding study design and selecting appropriate statistical models, through testing effects and interactions, to assessing model assumptions and interpreting results in relation to the research question.
For example, regression and mixed-modelling approaches can be used to investigate how rainfall magnitude, land-cover characteristics and green–blue infrastructure scenarios influence runoff generation in peri-urban catchments in Antananarivo. The skills gained through SEEC will therefore provide a valuable foundation for applying robust quantitative methods to the African Nature Lab’s diverse environmental and socio-ecological research.
